How to create data-rich documents with charts and tables?
Prerequisites
If you want to enrich your markdown content with charts and tables, you first need to add support for rendering markdown files in your PortalJS app. Follow this guide to learn how to do this.
PortalJS comes with a library of components that provides essential pieces for your data portal. The best way to explore the components is to look at our Storybook that contains all the details on how to use them. Below is an overview of available components.
You can install the library with:
npm i @portaljs/components
Now, in order to use these components in your markdown files, we need to pass them to our MDXRemote component (see this section in our markdown guide):
// e.g. /blog/[[...slug]].tsx
import fs from 'fs';
import { LineChart, Table, Catalog, Vega, VegaLite } from '@portaljs/components';

import { MdxRemote } from 'next-mdx-remote';
import clientPromise from '@/lib/mddb.mjs';
import parse from '@/lib/markdown';

const components = {
  Table: Table,
  Vega: Vega,
  VegaLite: VegaLite,
  LineChart: LineChart,
};

export default function Page({ source }) {
  source = JSON.parse(source);

  return (
    <>
      <MdxRemote source={source} components={components} />
    </>
  );
}

// Import metadata of a file matching the static path and return its parsed source and frontmatter object
export const getStaticProps = async ({ params }) => {
  const urlPath = params?.slug ? (params.slug as string[]).join('/') : '/';

  const mddb = await clientPromise;
  const dbFile = await mddb.getFileByUrl(urlPath);
  const filePath = dbFile!.file_path;
  // const frontMatter = dbFile!.metadata ?? {};

  const source = fs.readFileSync(filePath, { encoding: 'utf-8' });
  const { mdxSource } = await parse(source, 'mdx', {});

  return {
    props: {
      source: JSON.stringify(mdxSource),
      // frontMatter
    },
  };
};
You can now use these components in your markdown, like so:
### My Data Rich Note

Some markdown here.

<Table csv={`
Year,Temp Anomaly
1850,-0.418
2020,0.923
`} />

Some markdown here.
PortalJS components
Table
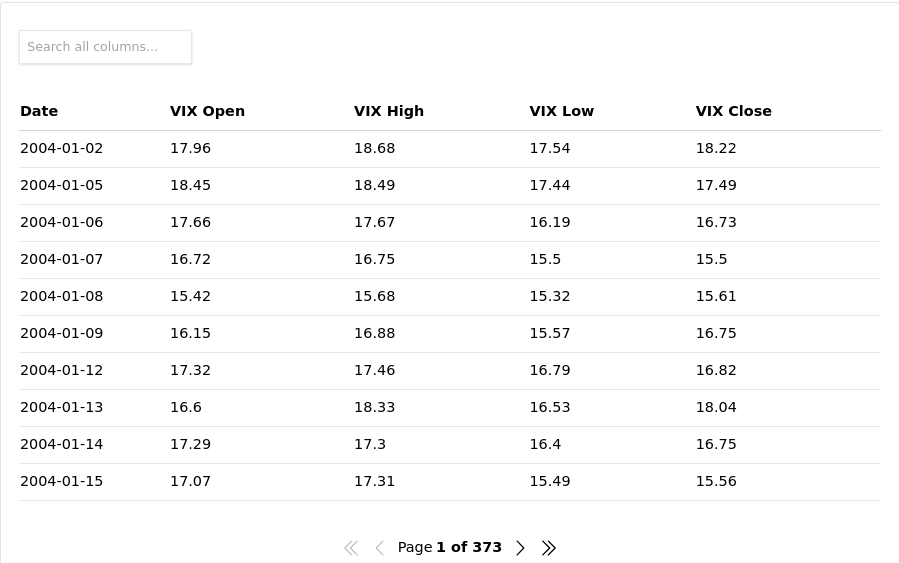
An easy-to-use table component with built-in pagination, search, and sorting. It can be used with raw data, raw CSV strings or with URLs to hosted CSV files.

Example usage:
<Table
  cols={[
    {
      key: 'id',
      name: 'ID',
    },
    {
      key: 'firstName',
      name: 'First name',
    },
    {
      key: 'lastName',
      name: 'Last name',
    },
    {
      key: 'age',
      name: 'Age',
    },
  ]}
  data={[
    {
      age: 35,
      firstName: 'Jon',
      id: 1,
      lastName: 'Snow',
    },
    {
      age: 42,
      firstName: 'Cersei',
      id: 2,
      lastName: 'Lannister',
    },
  ]}
/>
InfoMore info on the storybook page
Linechart
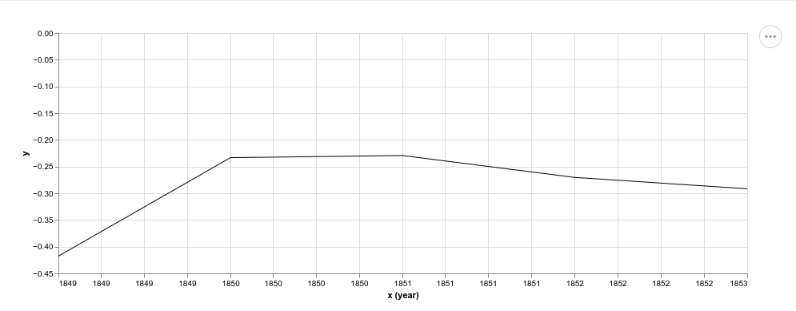
A simple component that allows the creation of an opinionated line chart without the need to go deep into charting standards. It can be used with raw data, raw CSV strings or with URLs to hosted CSV files.

Example usage:
<LineChart
  data={[
    ['1850', -0.41765878],
    ['1851', -0.2333498],
    ['1852', -0.22939907],
    ['1853', -0.27035445],
    ['1854', -0.29163003],
  ]}
/>
InfoMore info on the storybook page
Vega chart
A wrapper around the Vega specification that allows you to build pretty much any kind of chart imaginable.
Example usage:

<Vega
  data={{
    table: [
      {
        x: 1850,
        y: -0.418,
      },
      {
        x: 2020,
        y: 0.923,
      },
    ],
  }}
  spec={{
    $schema: 'https://vega.github.io/schema/vega-lite/v4.json',
    data: {
      name: 'table',
    },
    encoding: {
      x: {
        field: 'x',
        type: 'ordinal',
      },
      y: {
        field: 'y',
        type: 'quantitative',
      },
    },
    mark: 'bar',
  }}
/>
InfoMore info on the storybook page
VegaLite chart
A wrapper around the Vega Lite specification which allows for a more concise grammar than Vega around the building of charts.
Example usage:
<VegaLite
  data={{
    table: [
      {
        x: 1850,
        y: -0.418,
      },
      {
        x: 2020,
        y: 0.923,
      },
    ],
  }}
  spec={{
    $schema: 'https://vega.github.io/schema/vega-lite/v4.json',
    data: {
      name: 'table',
    },
    encoding: {
      x: {
        field: 'x',
        type: 'ordinal',
      },
      y: {
        field: 'y',
        type: 'quantitative',
      },
    },
    mark: 'bar',
  }}
/>
InfoMore info on the storybook page
Catalog
A searchable catalog that will index a list of datasets and allow for contextual searching + filters.

Example usage:
<Catalog
  datasets={[
    {
      _id: '07026b22d49916754df1dc8ffb9ccd1c31878aae',
      metadata: {
        'details-of-task': 'Detect and categorise abusive language in social media data',
        language: 'Albanian',
        'level-of-annotation': ['Posts'],
        'link-to-data': 'https://doi.org/10.6084/m9.figshare.19333298.v1',
        'link-to-publication': 'https://arxiv.org/abs/2107.13592',
        medium: ['Text'],
        'percentage-abusive': 13.2,
        platform: ['Instagram', 'Youtube'],
        reference: 'Nurce, E., Keci, J., Derczynski, L., 2021. Detecting Abusive Albanian. arXiv:2107.13592',
        'size-of-dataset': 11874,
        'task-description': 'Hierarchical (offensive/not; untargeted/targeted; person/group/other)',
        title: 'Detecting Abusive Albanian',
      },
      url_path: 'dataset-4',
    },
  ]}
/>
You can also add facets that are going to act as filters for your metadata.

<Catalog
  datasets={[
    {
      _id: '07026b22d49916754df1dc8ffb9ccd1c31878aae',
      metadata: {
        'details-of-task': 'Detect and categorise abusive language in social media data',
        language: 'Albanian',
        'level-of-annotation': ['Posts'],
        'link-to-data': 'https://doi.org/10.6084/m9.figshare.19333298.v1',
        'link-to-publication': 'https://arxiv.org/abs/2107.13592',
        medium: ['Text'],
        'percentage-abusive': 13.2,
        platform: ['Instagram', 'Youtube'],
        reference: 'Nurce, E., Keci, J., Derczynski, L., 2021. Detecting Abusive Albanian. arXiv:2107.13592',
        'size-of-dataset': 11874,
        'task-description': 'Hierarchical (offensive/not; untargeted/targeted; person/group/other)',
        title: 'Detecting Abusive Albanian',
      },
      url_path: 'dataset-4',
    },
  ]}
  facets={['platform', 'language']}
/>
InfoMore info on the storybook page